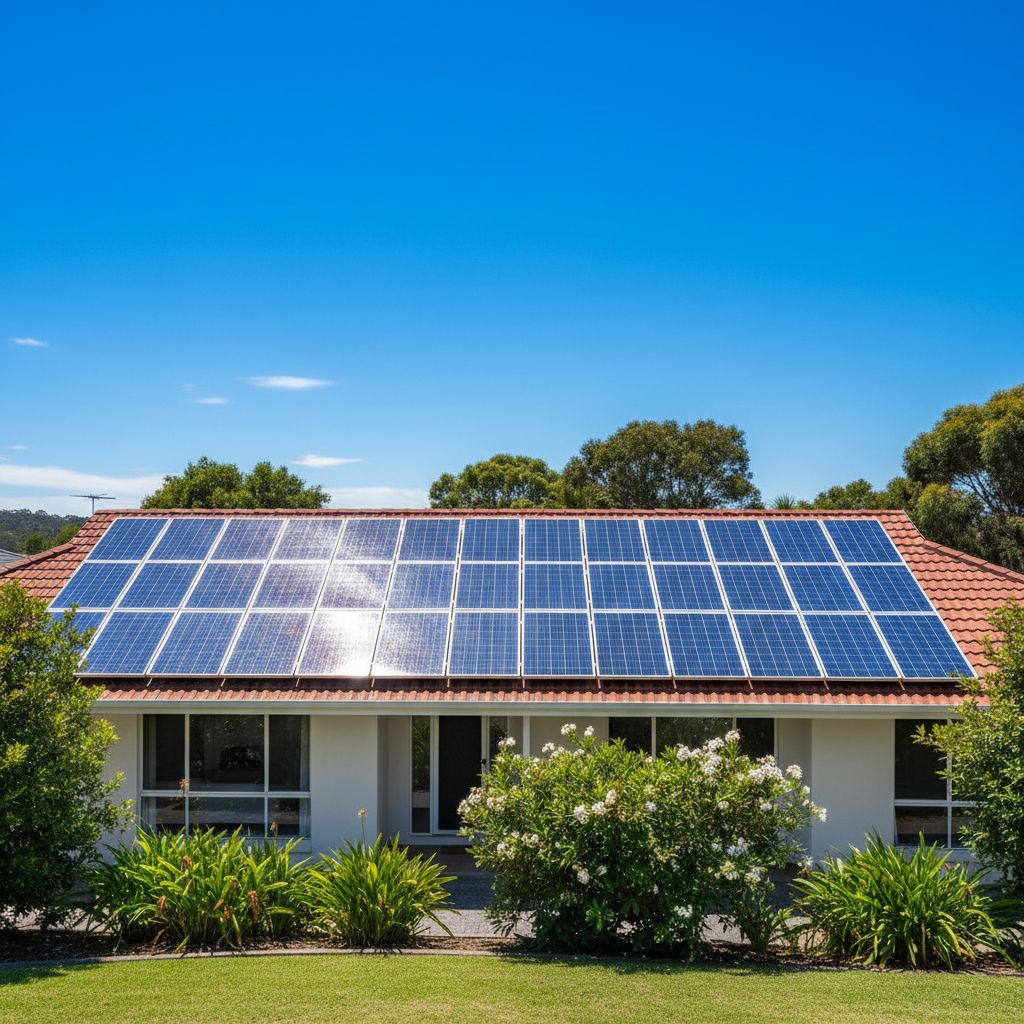
Solar performance & output test in Townsville.
After 8-13 years on a Townsville rooftop, every solar array degrades unevenly — some modules fine, others showing PID, microcracks or hotspots. An IV-curve test per string is the only way to find the bad ones. We measure each string against original nameplate, identify the underperformers, and provide the documentation for a Tier-1 warranty replacement claim if degradation exceeds spec.
What a Townsville output test covers.
Clamp-meter readings on each string.
The first measurement is a simple DC clamp-meter on each string conductor under load — gives us the string-level current and voltage, which we cross-reference against the inverter’s own logged numbers and the expected reading for the panel count + tilt + orientation at the measurement time. Discrepancies between strings on the same array immediately flag which string is underperforming and worth deeper investigation.
Full IV-curve test per string.
The definitive test is a full I-V curve trace per string, taken with a portable IV-curve tracer (we use a Seaward PV200 or HT IV400 class instrument). The trace shows the open-circuit voltage, short-circuit current, maximum-power point, and the shape of the curve under partial-load conditions. Comparing the measured curve to the manufacturer’s reference curve adjusted for irradiance and temperature reveals:
- Potential-induced degradation (PID) — voltage leakage to the frame, common in older systems with ungrounded inverters.
- Microcracks in cells — trace shows characteristic step-changes in current.
- Hotspots — partial shading or cell-level failure forcing a single cell to dissipate power as heat.
- Diode failure — bypass-diode short circuits visible as voltage drops.
- Connector / wiring degradation — resistance steps in the curve from corroded MC4 connectors or sun-degraded cable.
Townsville-specific baseline.
The expected degradation rate for Tier-1 panels in Townsville is roughly 0.5% per year — meaning a 10-year-old 5kW system in good condition should still measure around 4.75kW at standard test conditions. Anything significantly worse than that warrants investigation. We benchmark every test against the Townsville climate-adjusted baseline (allowing for typical summer thermal derating) so we’re comparing like with like, not against a southern-state lab figure.
Warranty replacement claim documentation.
If the test shows degradation outside the manufacturer’s warranted curve (typically >3% in the first year, >0.7%/yr after that for Tier-1 product warranty), we provide a full warranty-claim documentation package — IV-curve trace files, panel-by-panel inferred performance, install records (where available), annual-clean certificates, inverter health-check reports. Tier-1 manufacturers (Trina, LG, REC, Jinko) require this level of evidence before honouring a replacement claim — without it, the answer is always no.
When to book an output test.
- Whenever inverter telemetry shows output dropping below expected by 10%+ on a clean array.
- Annually as part of a maintenance plan on FiT-era systems still earning the 44c tariff.
- After a major hail or storm event — microcracks may be invisible.
- Pre-sale — gives the buyer confidence and avoids price negotiation.
- For warranty claims — the manufacturer will ask for IV-curve evidence.
Pricing.
- Single-string system (small 3-4kW): $180–$220
- Two-string standard 5-6.6kW residential: $220–$280
- Multi-string 8-10kW: $260–$320
- Commercial / larger arrays: quoted on site
Bundle with a panel clean and inverter health-check for combined discount, or include in our annual maintenance plan.
Where we work.
Book your IV-curve output test.
Per-string trace + per-panel inferred performance. Tier-1 warranty-claim documentation included.